


How to get Google Analytics 4 (GA4) conversion rate and other event metrics with the native Looker Studio connector
Against all odds, let’s include in our Google Analytics 4 report:
- The session conversion rate of a any specific event
- The total events of a specific event as a metric column of a chart
Google Analytics 4 and Looker Studio: Introduction and technical context
Looker Studio (formerly known as Google Data Studio) offers a native connector to load data from Google Analytics 4. Behind the scenes, this connector uses GA4 Data API providing aggregated data from the last version of GA.
GA data respect a specific schema combining user, session, item and event based scopes for available dimensions and metrics regarding each request made through the API. On the other hand, for the moment, all the fields available from the GA4 data API are not yet passed through the connector.
For the concerns of this article, inside Looker Studio:
- If you wish getting the number of times a specific event has occurred, you need to filter or break down your event count by the related event names as a subset of your main data set (to not interfere with other coexisting scopes & related data)
- The GA4 session conversion rate is not available on Looker Studio when I’m writing this article. But when it will be released, the same problem will need to be solved taking care of the same constraints described above: if you’ve got several event names, defined as conversions like “purchase” & “generate_lead”, it will make sense to follow each conversion rate separately…as a simple scorecard or as part of a collection of metrics with other scopes…
One of the main constraints of Looker Studio lies in the impossibility to mix aggregated and not aggregated fields for filtering purposes, and even when the GA4 connector will be up to date with all the available GA4 Data API fields, the problem will be still the same, requiring to be solved with the same workaround on Looker Studio side…Data blending.
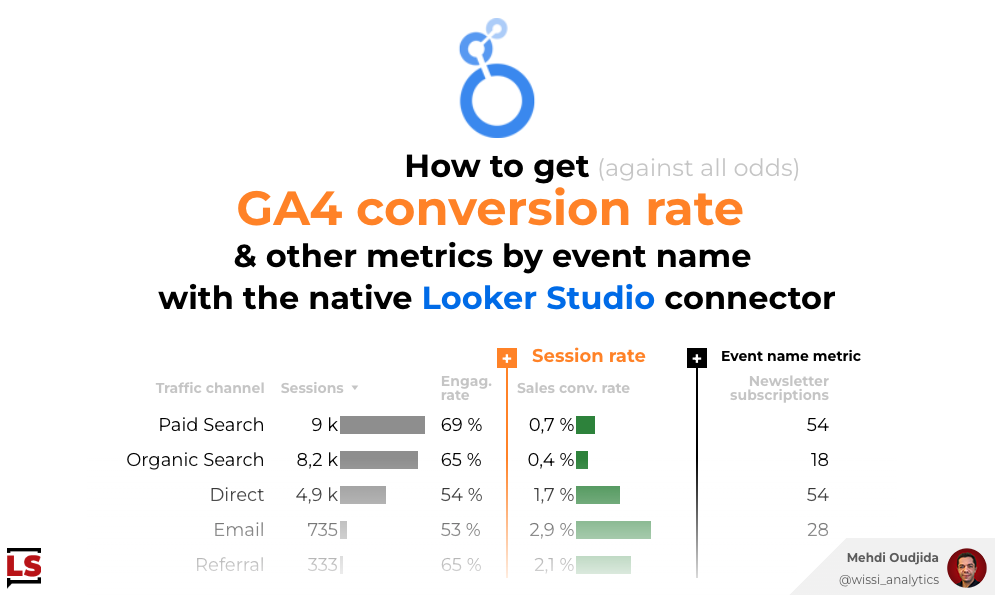
So, for this tutorial, we will include in the same table chart:
- A session-scoped dimension: Traffic channel (Session default channel grouping)
- A basic metric: Sessions
- A recalculated metric: Engagement rate
- The homemade session conversion rate, specific to online sales
- The count of ‘newsletter_subscription’ event
Ingredients to insert a GA4 conversion rate and event metrics in the same chart
For this exercise, we need the following elements:
- Your GA4 data source
- Blended data to prepare and join data from separate scopes
- A table chart to display the final merged data (something looking like a simplified ABC Acquisition – Behavior -Conversion chart)
- Some chart calculated fields and specific aggregation options
1. The Google Analytics 4 data source
First, we add or check the presence of your GA4 data source in your report. To keep it as simple as possible, I like to turn off all unnecessary fields for clarity and performance purposes. So, of course, to go fast with bulk actions and not be lazy for data and Looker Studio interface curation, I use the data sources tab of my Looker Studio Companion, the Chrome extension.
For this tutorial, I keep the following dimensions and metrics:
- Session default channel group
- Event name
- Sessions
- Engaged sessions
- Event count
- Sessions

And, to avoid to reach Data API thresholds of request quotas, I also turn off data loading requests (settings tab of the extension) during the first steps of the report configuration, before working on visual rendering and styles.
End of the auto promo for my free tool 🙂
2. Blended data
Now, we configure blended data “BD – Channel with event metrics” as described below.
- First table – “GA4 – Master prop”
- Table name: “Total”
- Dimension: “Session default channel grouping” renamed “Traffic channel”
- Metrics:
- “Sessions” renamed “Total sessions”
- “Engaged sessions” renamed “Total engaged sessions”
- Second table – “GA4 – Master prop”
- Table name: “Events”
- Dimensions:
- “Session default channel grouping” renamed “Traffic channel”
- Event name
- Metrics:
- Sessions
- Event count
- Filter: “GA4 – Events for metrics”
- Include Event name when regex match ^(newsletter_subscription|purchase)$
- Feel free to adapt the regex regarding the events you wish from your data
- Join configuration
- Operator: Left join
- Conditions and keys : Traffic channel from “Total” & “Events” tables


3. Chart configuration
At last, we create the table chart:
- Chart type: Table chart
- Setup tab
- Data source: Your blended data “BD – Channel with event metrics”
- Dimension: “Traffic channel”
- Metrics:
- “Total Sessions” renamed “Sessions”, changing the default aggregation to Average
- Engagement rate” with the formula of calculated field below
- “Sales conversion rate” with the formula of calculated field below
- “Newsletter subscriptions” with the formula of calculated field below
- Adapt the Style tab options
- Colors, tex size, decimal precision, metrics displayed as bars…
Engagement rateAVG(Total engaged sessions)/AVG(Total sessions)Sales conversion rateIF(Event name="purchase",Sessions/Total sessions,0)Newsletter subscriptionsIF(Event name="newsletter_subscription",Event count,0)
Final thoughts
That’s all. It was quite simple 🙂
Against some adaptations, you should address most of your use cases with this tutorial:
- Adapting the event name filter to focus on the right events
- Using the sessions by event name to deduplicate event count by session (event sessions) for acquisition performance purposes and dimension participation
- No requiring to turn on an event as a conversion to get the related conversion rate


